python matplotlib中常用函数
- 绘图
- 常见设置
- 散点图
- 柱状图
- 等高线
- matplotlib绘制3D图
- 子图像
- 动态图
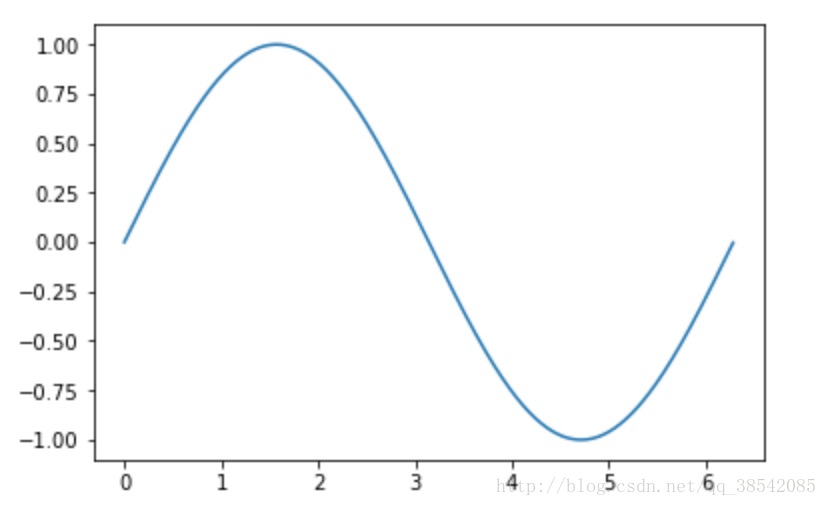
绘图
1 | import matplotlib.pyplot as plt #倒入matplotlib库 |
常见设置
设置坐标轴
一、
1 | # x轴和y轴的值域 |
二、
1 | plt.gca #获取当前的坐标轴 |
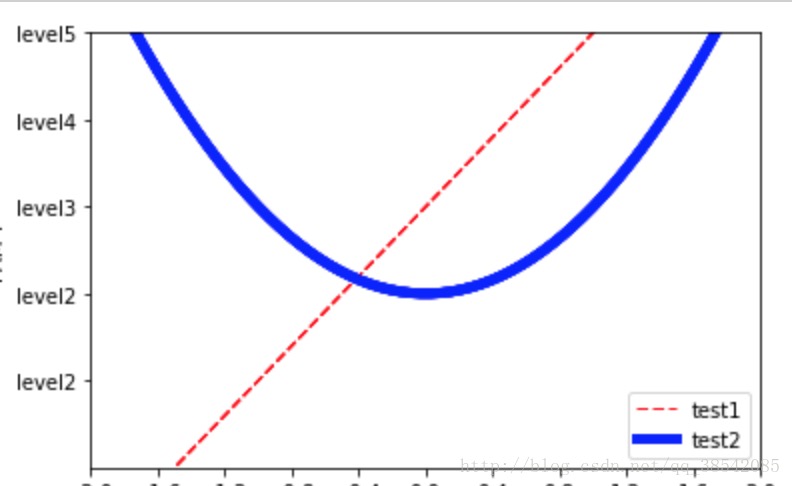
三、
1 | l1, = plt.plot(x,y1,color='red',linewidth=1.0,linestyle='—') #设置两条线为l1,l2 注:应该在后面加上, |
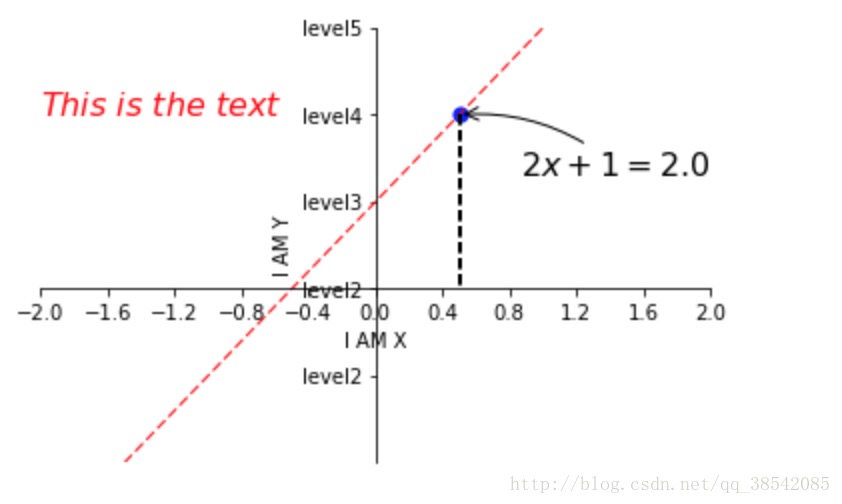
设置备注
1 | x0 = 0.5 |
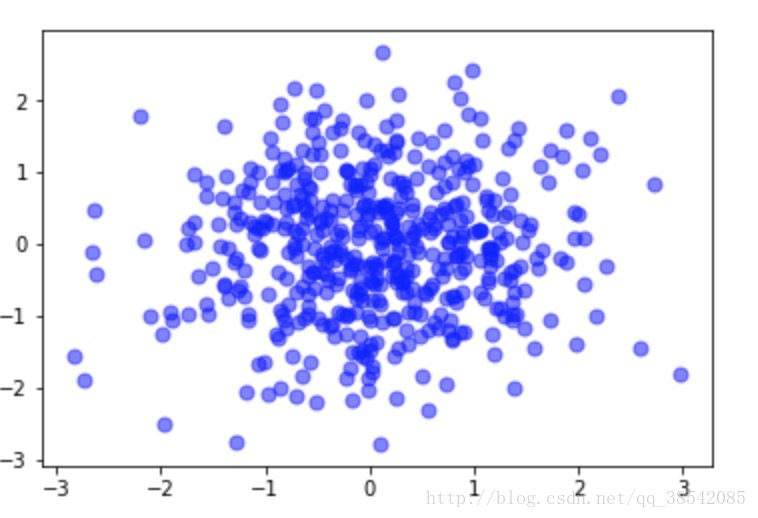
散点图
1 | x = np.random.normal(0,1,500) |
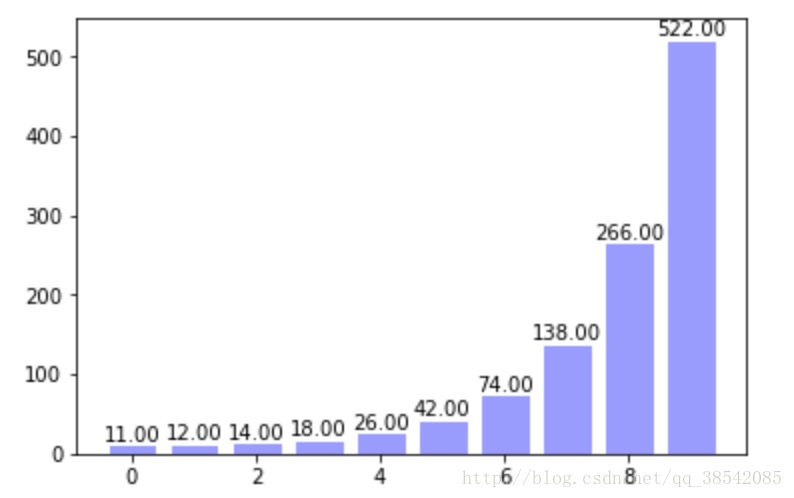
柱状图
1 | x = np.arange(10) |
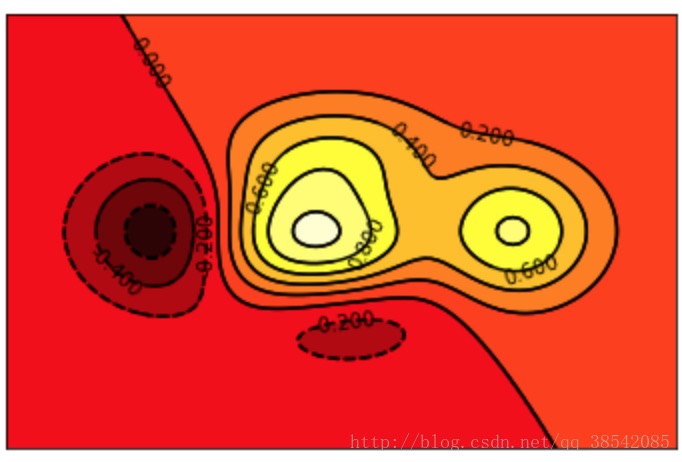
等高图
1 | def f(x,y): |
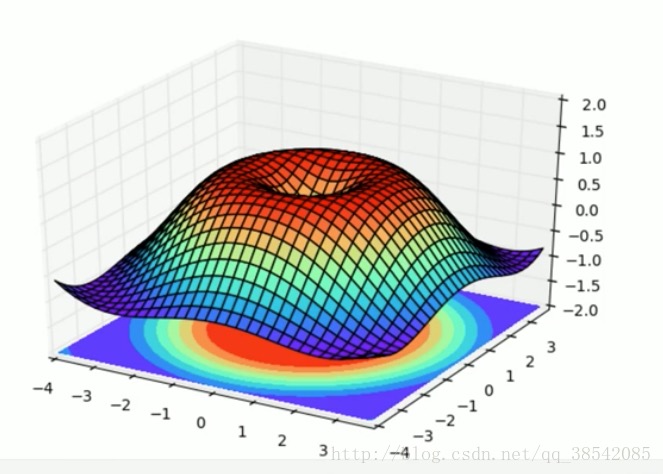
matplotlib绘制3D图
1 | from mpl_toolkits.mplot3d import Axes3D#动态图所需要的包 |
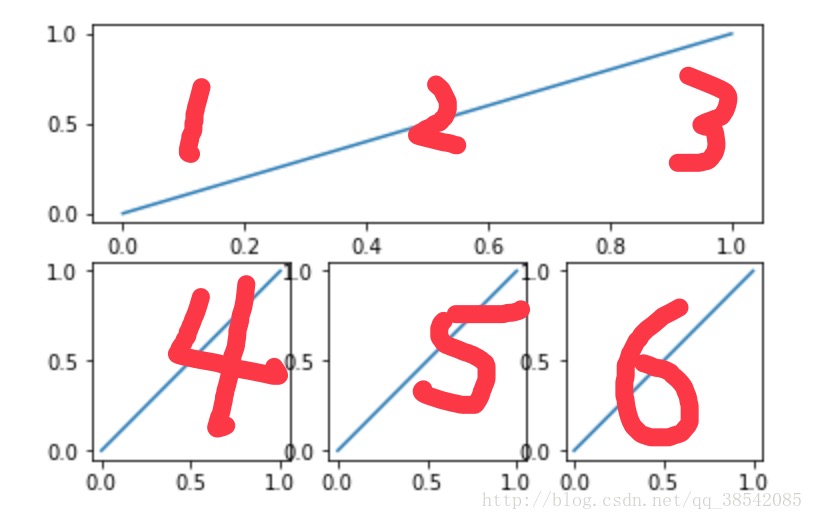
子图像
1 | plt.figure() |
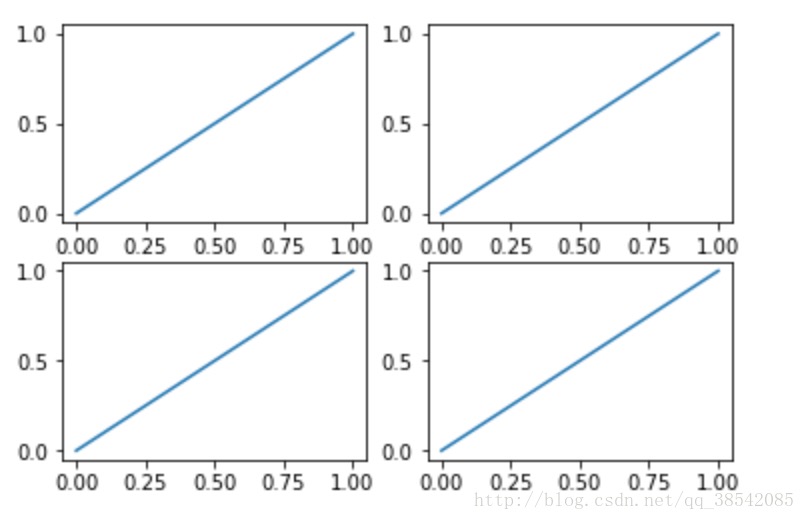
1 | plt.figure() |
动态图
1 | from matplotlib import animation#动态图所需要的包 |